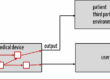
The risk acceptance matrix, also known as the risk assessment matrix, is a proven tool that (medical device) manufacturers use to express their (product-specific) criteria for risk acceptance.
Notified bodies often check the risk acceptance matrix first and especially intensively when assessing the conformity of the technical documentation with the statutory requirements.
This article helps create a risk acceptance matrix that complies with standards and legislation and helps avoid the 6 most common mistakes.
1. Risk acceptance matrix / risk assessment matrix – an overview
Risks are defined as the combination of severities of harm and probabilities of harm. Thus, they are a two-dimensional quantity that can be expressed as a two-dimensional matrix (see Fig. 1).
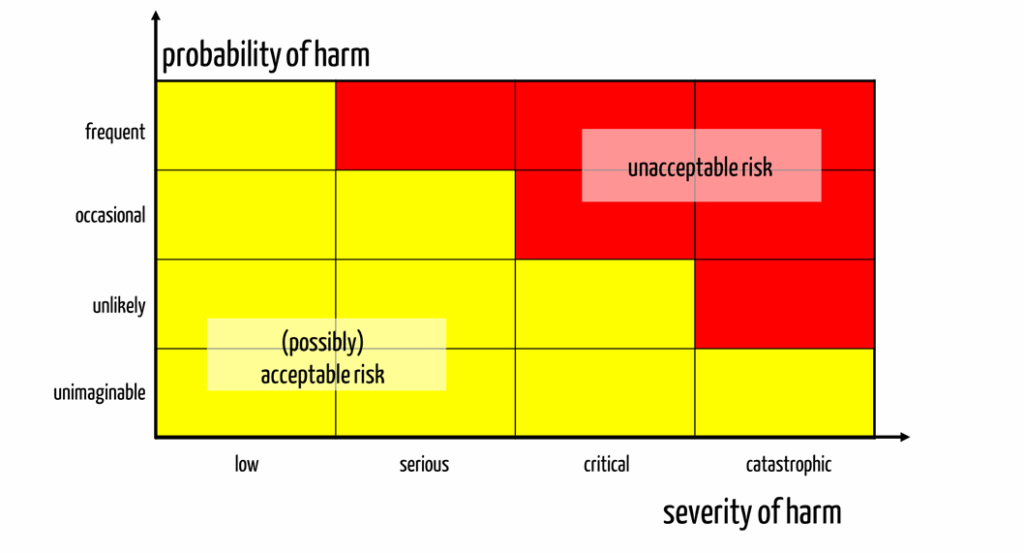
This matrix divides the severities and probabilities into classes, typically between three and seven classes for each dimension.
High risks are associated with high probabilities and severities, while low risks are associated with low probabilities and severities.
Manufacturers express risk acceptance by color coding the individual cells of the matrix (see Fig. 1).
It is not compliant with ISO 14971 to define risks as the product (multiplication) of severity and probability and to determine a limit value for this product that separates acceptable and unacceptable risks.
2. Regulatory requirements
There is no statutory requirement to express risk acceptance in the form of a risk acceptance matrix.
ISO 14971 does not require a risk assessment matrix, although it did show one in the informative Annex in older editions. In these older editions, EN ISO 14971 distinguished between acceptable, unacceptable, and risks in the ALARP (“as low as reasonably practical“) range.
Since the 2012 edition of EN ISO 14971, there have been no longer any generally acceptable risks. Therefore, the division into acceptable, unacceptable, and ALARP risks is obsolete. Instead, risks must be “as low as reasonably possible.”
If you are still working with a risk acceptance matrix that contains three colors (red, yellow, and green), you will attract the attention of your auditor. This is because there is a high probability that there are still generally acceptable (“green”) risks. This is neither compliant with standards nor with the law.
On the other hand, the FDA expects a risk acceptance matrix in the risk management file, even if it has not explicitly documented this requirement.
With the help of dozens of sample templates and videos on ISO 14971-compliant risk management, you will learn how to create a complete risk management file with all the necessary documents. Check your documents for compliance yourself and avoid errors during audits and submissions.
3. Tips for creating a risk acceptance matrix / risk assessment matrix
a) Tips for defining the severity axis
There are a few pitfalls to watch out for when defining the severity axis. For example, adding a few labels such as insignificant, minor, severe, critical and catastrophic to the categories is not enough. You need clear classification rules, for example:
- Death (yes or no)
- Life-critical harm (yes or no)
- Medical intervention necessary (yes or no)
- Reversible harm (yes or no)
But even with this, there are still unanswered questions: Which is worse, life-threatening, non-reversible harm or non-life-threatening, non-reversible harm? A lost thumb or a permanently disabled leg?
Take a look at our article on the severity of harm. It explains how to classify these degrees of severity.
Once again, it is clear that defining these ethical principles is not a task for development, but for management. This is exactly what ISO 14971 requires.
b) Tips for defining the probability axis
For the probability axis, you should have a class that represents probabilities so low that events (in this case, harm) will not occur for all devices during the product’s entire service life. These are usually tiny probabilities.
On the other hand, manufacturers may want to evaluate harms differently that occur once in every user and once in only every 100 users. This requires different probability classes.
The result is a logarithmic scale with probability classes that usually cover two orders of magnitude (see example in Table 1).
| Term | Description | Frequency (per treatment) |
| Frequent | Once or several times per treatment | x ≥ 100 (≥ 1) |
| Probable | May occur during normal use | 10-2 ≤ x < 100 |
| Occasional | Occurs at irregular intervals several times per month/year | 10-4 ≤ x < 10-2 |
| Hardly imaginable | Once or several times per service life of the medical device | 10-6 ≤ x < 10-4 |
| Unlikely | Not during the service life of the medical device | 10-8 ≤ x < 10-6 |
| Unimaginable | Not during the service life of all devices | x < 10-8 |
c) Tips for defining the acceptance criteria
Risks are only acceptable if they are as low as possible and the benefits outweigh the risks. The risk acceptance matrix must fulfill precisely this requirement.
Example
Let’s assume that every 10,000 manual drug selections and dose calculations in an intensive care unit result in an error with fatal consequences, e.g., due to a contraindication, drug-drug interaction, or a calculation error.
The intended purpose of software is to support drug selection and dose calculation.
Under no circumstances should errors in this software or in its use lead to fatal medication errors more frequently. If the state of the art is no longer manual selection and dose calculation but computer-aided medication, then the acceptance criteria must at least meet this state of the art.
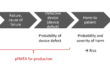
Assuming that a fatal medication error only occurs in every 100,000 cases (10-5) as a result of software-assisted medication, then the maximum acceptable risks in the probability categories “unlikely” and “unimaginable” in the probability categories according to Table 1 would be acceptable (see Fig. 2).
In the clinical evaluation, the manufacturer must quantitatively demonstrate the state of the art and the benefits of alternative procedures. Thus, the clinical evaluation serves as input for determining the risk acceptance matrix/risk assessment matrix.
4. Common mistakes manufacturers should avoid
Mistake 1: Risk assessment matrix in the QM manual
The risk-benefit assessment and, thus, the risk assessment matrix must be product-specific. It, therefore, generally makes no sense to define the risk assessment matrix in the QM manual or an “SOP risk management.”
Instead, the manufacturer should determine the product-specific risk acceptance criteria in a separate document or in the risk management plan.
Mistake 2: Risk acceptance is not derived
Many manufacturers tend to fix their risk policy based on their gut feeling. Therefore, it is important to follow the tip under 3.c).
Mistake 3: Working with a risk priority number
ISO 14971 defines risk as a two-dimensional quantity. The risk priority number does not correspond to this definition. It may be used in FMEA but not for quantifying risks and defining risk acceptance criteria.
Mistake 4: Not updating the risk assessment matrix
The risk assessment matrix must represent the state of the art (see tip in 3.c)). The state of the art changes.
Example: CT scanner
The benefits of CT devices are based on the alternatives available. The relative benefit decreases to the extent that, for example, MRI devices, which do not have a harmful radiation dose, can increasingly diagnose body structures that were previously the domain of CTs (e.g., bony structures).
Mistake 5: Risk acceptance matrix with “green” areas
It is not a mistake if the risk management file contains green areas.
However, if the color stands for “acceptable” risks, it is not in accordance with the law. This is because there are no generally acceptable risks: Every risk must be reduced as far as possible.
This means that the color green may only stand for areas in which risks are acceptable if they have been reduced as far as possible.
Please also note the article on the 7 most common mistakes in risk management.
Mistake 6: Probability axis does not represent the entire range
Suppose manufacturers define probability classes with an order of magnitude or even less. In that case, it is reasonable to suspect that they are not discussing the complete relevant probability range, as an extreme example shows:
- Frequent: p > 10-3
- Occasional: 10-4 < p ≤ 10-3
- Rare: 10-5 < p ≤ 10-4
- Unimaginable: p ≤ 10-5
Assume that all devices of one type are used 10+8 times over their entire lifetime. Then, the supposedly unimaginable case occurs 1000 times or less. This means the manufacturer is not able to differentiate between harms, e.g., fatal consequences, that occur statistically thousands of times, that occur once, or that occur 0.0001 times. That makes no sense.
Manufacturers can differentiate between events that occur with a probability of 10-4 and 10-5. However, they are usually not able to estimate this accurately.
Expressed graphically (see Fig. 3), one could say that these manufacturers buy an unnecessary differentiation capability at medium probabilities (analogous to severities) at the expense of the “fringe areas.”
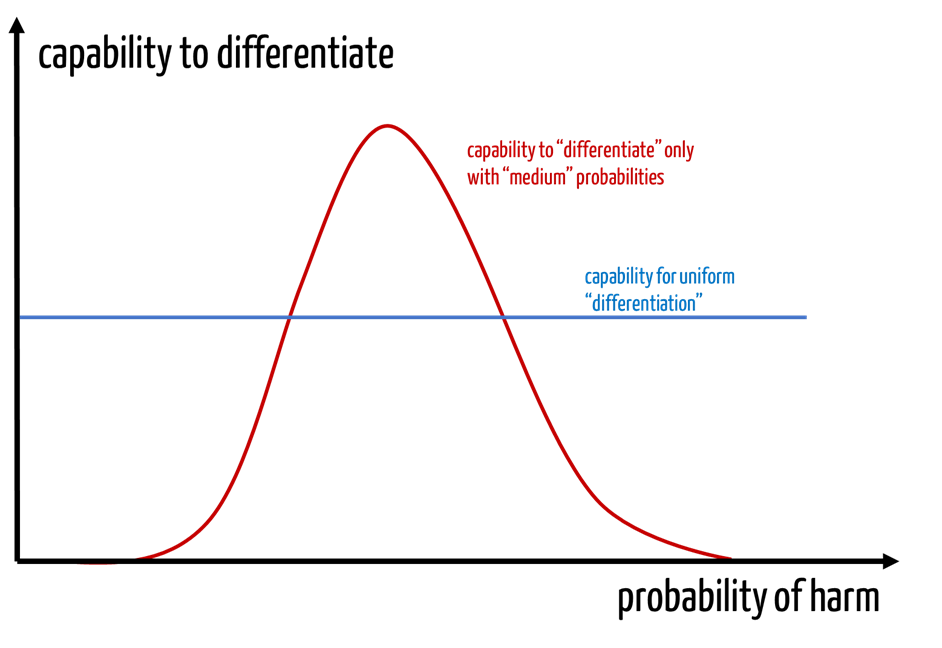
Analogous considerations also apply to the severity axis.
5. Conclusion and summary
The risk acceptance matrix / risk assessment matrix is a fundamental part of the risk management file. Auditors and investigators can often tell from this matrix whether manufacturers understand risk management and the benefit-risk ratio.
The risk acceptance matrix expresses this benefit-risk ratio specifically for the device in question. It must also be consistent with the risk policy and the output of the clinical evaluation.
Because the risk assessment matrix also reflects the state of the art, manufacturers must regularly (at least annually) check it for validity.
The Johner Institute supports manufacturers not only in creating the risk acceptance matrix, but also with the entire risk management file. The seminar “Risk management and ISO 14971” provides a quick introduction to the topic. Participants also learn how to create and evaluate risk acceptance matrices.