AQL stands for Acceptable Quality Level and is sometimes translated as “permitted reject rate.” The AQL determines when a batch of parts or products is rejected or accepted based on a random sample inspection.
However, auditors regularly no longer accept the AQL. What to do? This article provides answers.
1. Who is affected by the topic “AQL” and when
1.1 Affected roles
The following people and roles should be concerned with AQL
- Owners of processes whose intermediate or final results are evaluated on the basis of random samples, such as assembly and production processes
- Persons in quality management and quality assurance who define or check AQLs
- People responsible for supplier selection, supplier monitoring, and supplier evaluation
- Regulatory affairs managers who must ensure that regulatory requirements (e.g., ISO 13485 or FDA) are understood and complied with
- Product & risk managers who evaluate feedback from the field as part of post-market surveillance
1.2. In which context are AQLs used
Standards and laws require manufacturers to validate processes and check work and process results. However, a complete inspection is often not possible:
- The results are destroyed during the inspection, such as the testing of sterile packaging.
- The cost or effort of a full inspection is not economically justifiable.
Therefore, manufacturers use random sample testing to evaluate processes, products, and parts that they or their suppliers manufacture.
To do this, they must determine the maximum number of products that may not meet the specifications in this sample. The AQLs (Acceptable Quality Levels) are helpful for this determination.
This is not about acceptance criteria for an individual product, such as tolerances.
The AQLs are, thus, suitable for two contexts:
| Context | Accept | Reject |
| Process validation | Validation successful, process approved | Validation failed, process not approved (must be improved) |
| Production of products or parts | Lot/series is approved | Lot/series is blocked (further measures necessary) |
Notified bodies are increasingly questioning the suitability of AQL for process validation. The fifth section of this article describes why this is the case and the alternatives.
2. Where the AQLs help
2.1 Determining the sample size
Suppose a manufacturer allows a maximum of one percent of 200 products delivered to be defective, i.e., not meeting the specifications. How many random samples must he take?
2.2 Determining the maximum number
Assuming the sample size is 50, what is the maximum number of defective products?
2.3 Balance of supplier and buyer risk
There is a probability that the delivery may be rejected as defective, even though it meets the specified defect rate.
The manufacturer has specified that a maximum of one percent of the products may be defective. The supplier complies with the requirement: only one of the 200 products is delivered faulty. But during the random sample inspection (n = 50), unfortunately (for the supplier), exactly this one defective product is inspected. This means that one in 50 products (2%) does not meet the specifications, and the manufacturer rejects the entire batch.
Conversely, there is a probability that a delivery will be accepted as correct even though the delivery does not meet the specified error rate. This is a risk for the customer (in this case, the manufacturer or, in the worst case, the patients).
The manufacturer has stipulated that a maximum of one percent of the products may be defective. The supplier does not comply with this requirement: 10 of the 200 products are delivered with defects. Unfortunately (for the customer), however, none of these defective products are inspected during the random sample inspection (n = 50). Consequently, the manufacturer accepts the entire batch.
How can the manufacturer do justice to both?
The AQLs can be used to provide justifications in all three scenarios.
3. How to use the AQLs
3.1 The “OC Curves“
AQLs indicate the proportion of defective products/units that the manufacturer accepts according to the sampling plan. They also define the supplier risk and the buyer risk.
A manufacturer sets the AQL as 1.5%. He sets the supplier risk at 0.05. This means that in 95% of cases, the manufacturer actually accepts a batch from a supplier with a maximum of 1.5% defective products or (unjustifiably) rejects this batch in 5% of cases.
This proportion is usually expressed as a function, the OC Curve (Operating Characteristics Curve). This function expresses the probability of accepting a product/unit, depending on the proportion of defective units. Fig. 1 shows an example of this calculation.
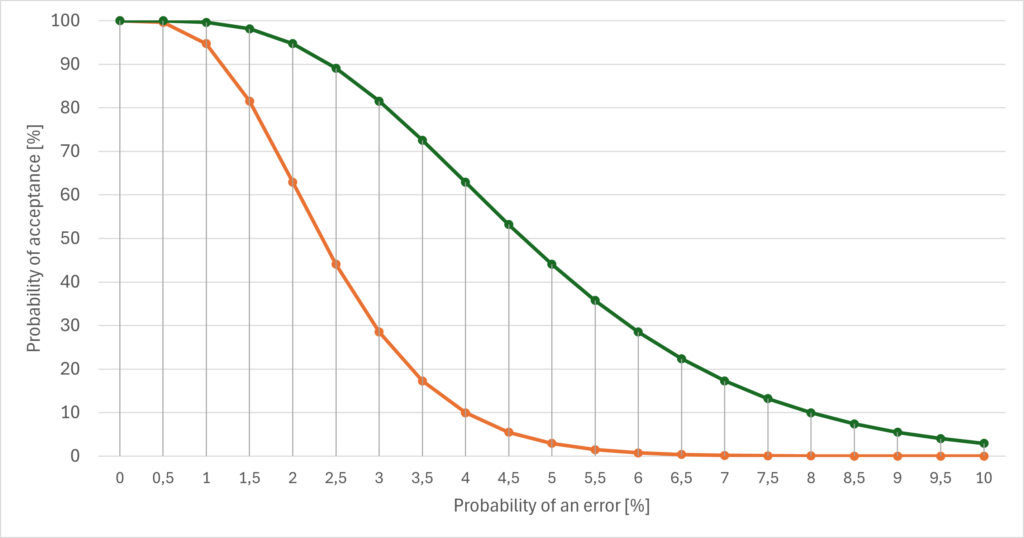
If all units meet the specifications, i.e., if there are no (0%) defective units, then the acceptance probability is 100%. Therefore, all curves in Fig. 1 intersect the y-axis at 100%.
Conversely, the acceptance probability should be 0% if all units are (100%) defective. This can be seen in Fig. 1: As the probability of error increases, the curves approach the x-axis, where the probability of acceptance is 0%.
In the example above (orange curve), the probability of accepting 1% defective units is around 95%. The probability of accepting 3% defective units has dropped to 28%. The probability that the recipient will accept units that are 10% defective in the sample is now only 2 x 10⁻⁶.
3.1.1 Impact of the sample size
Fig. 1 also shows that a lower sample size (green curve) leads to a higher probability of acceptance than a higher sample size (orange curve), with all other parameters remaining unchanged. A lower sample size reduces the probability of encountering an error.
3.1.2 Impact of the number of acceptable errors
The maximum number of tolerable errors also determines the probability of acceptance (see Fig. 2).
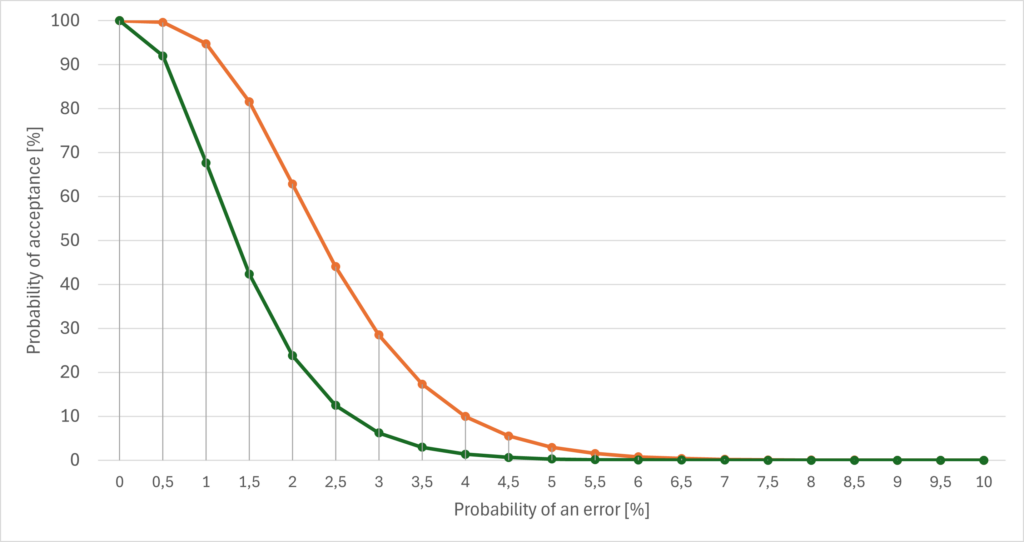
The orange curve represents a maximum of four permitted faulty units (out of a total of 5000 with a sample size of 200). The green curve only represents a maximum of two faulty units with otherwise identical parameters.
3.2 AQL tables
In practice, however, you usually do not work with formulas but with tables (this section) or software tools (see section 3.3).
3.2.1 Step 1: Determining the “code letters”
Working in tables is done in two steps. The first step is to select the row with the number of units (“Lot Size”) in the first table (see Fig. 3). In the example above, with 5000 units, this would be the line highlighted in yellow.
Then select the “General Inspection Level”. A higher level corresponds to a more stringent inspection. As an example, we select the medium level II. The result is the letter “L,” which is required for the second step.
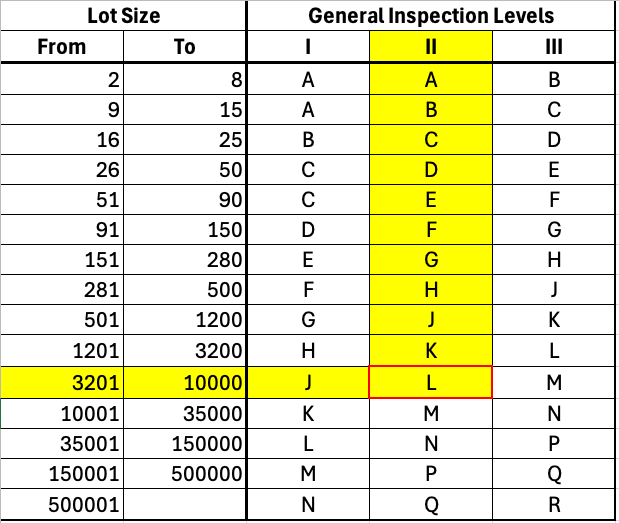
In addition to the three “General Inspection Levels,” there are four “Special Inspection Levels” for more critical units.
3.2.2 Step 2: Determining the sample size and defining the AQL
In the second step, you can identify the sample size, as shown in the example above 200 (see red outlined cell in yellow marked row in Fig. 4).
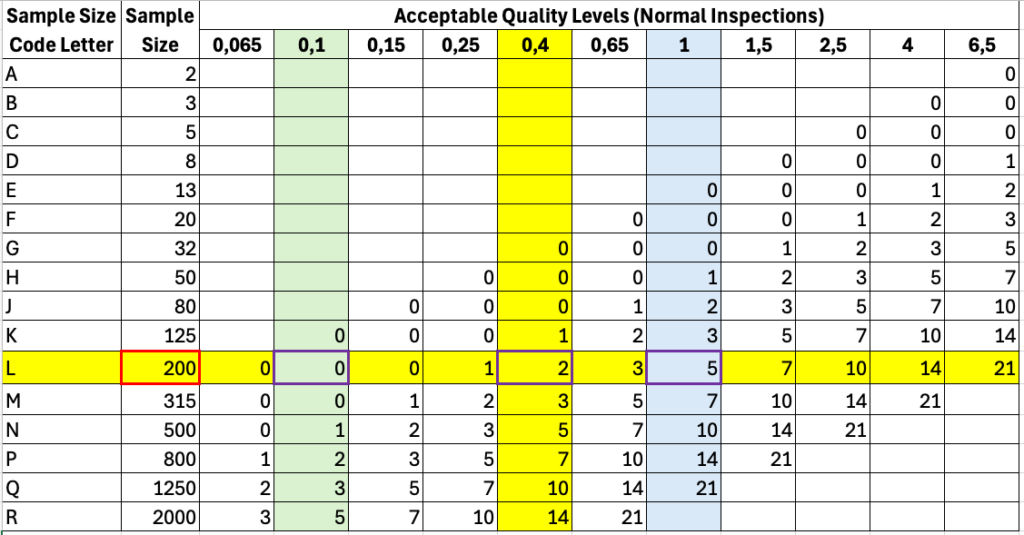
The AQL determines the maximum number of faulty units from this sample. At an AQL of 0.1, no unit may be faulty; at an AQL of 0.4, two units may be faulty; and at a level of 1, a maximum of 5 faulty units may be permitted (see purple-bordered cells in Fig. 4.).
The standards ISO 2859-1 and ISO 16269-1 define tables and provide further information on the application of the procedure. The ISO 16269-1 tables calculate the sample size as a function of the confidence interval.
3.3 Software tools
In practice, manufacturers use software tools that implement the calculations.
- Calculator of the University of Leuwen
- Calculator of „Asia Quality“
- Calculator of HQTS
- Calculator of QIMA
4. What to consider with AQLs
4.1 Choose the samples as randomly as possible
To ensure that the samples are as random as possible, the investigators should plan the sampling precisely, taking various aspects into account:
- Time: shift, start or end of shift, time, day of the week, summer ó winter, before ó after production step
- Location: top ó bottom of the pack, front ó back of the batch, production plant 1 ó 2, …
- Condition: refrigerated ó non-refrigerated, sterile ó non-sterile, packaged ó unpackaged, …
- Sampling: by hand ó with tools, at discretion ó according to random generator, foreman ó vacation replacement, …
The documentation of sampling, investigation, and evaluation should also be planned. Work instructions and forms or computer-aided recording are recommended here.
4.2 Define the AQL level based on risk
It is common practice to allow different numbers of defective products in the sample (i.e., AQLs) for defects of different criticality, as the following example shows:
| Severity of error | AQL |
| Errors that can lead to serious harm | 0*) |
| Errors that affect safety and performance but cannot lead to serious harm | 0,065 |
| Errors that affect functionality but cannot lead to harm | 0,4 |
| Decorative flaws e.g., scratches | 1 |
*) The manufacturer does not carry out a statistical review; the AQL system is not used.
4.3 Consider the legal requirements
While ISO 13485 in Chapter 7.5.6 d) “only” requires the choice of statistical procedures to be justified when validating products, the FDA sets out specific requirements in some cases. One of the few examples is 21 CFR part 800.20 for gloves (see Fig. 5). Otherwise, it is left to the manufacturers to determine this sample size.
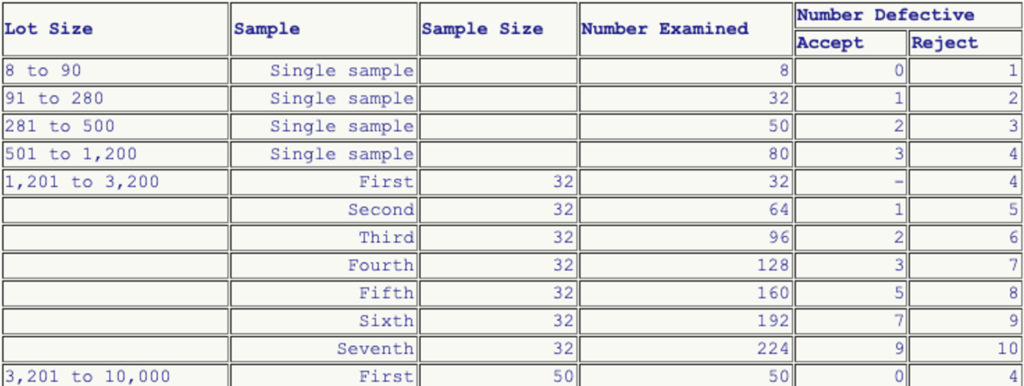
Other FDA requirements relate to the sampling method, such as for stents in the associated guidance document. The FDA also specifies the percentage of “test balloons” that must pass the test.
The FDA’s “Quality System Inspection Techniques” (QSIT) also specify sampling plans, although these are more relevant to FDA inspectors.
5. When you are allowed to use AQL
5.1 Criticism
Manufacturers are increasingly reporting that notified bodies no longer accept AQLs as a justification for the sample size.
The main criticism revolves around the AQL’s beta value (rejection rate) of 10%, which is considered too supplier-friendly and allows a correspondingly large tolerance. It is, therefore, too imprecise and unsuitable for the validation of critical processes as a statistical method for justifying the sample size according to ISO 13485 in Chapter 7.5.6 d).
Accordingly, auditors would use the state of the art to argue that the AQL originated in the US Army during the Second World War and that the math for it was relatively simple. This criticism is justified from a statistical point of view. However, no explanation is given as to why more complex mathematics would be better.
5.2 Alternative
Process capability indices such as CP and CPK are used in process validation in other industries. These also have limitations from a statistical point of view, so auditors increasingly expect a justification of the sample in process validation based on ISO 16269-6. ISO 16269-6 also contains various tables with pre-calculated values for nonconforming units for different acceptance probabilities. Still, it leaves it up to the reader to determine the sample size, which is not mathematically trivial.
However, the AQLs are (still) very useful for incoming goods inspections, for example.
6. Conclusion
Manufacturers, especially of IVDs and medical devices, must validate products and processes. This validation is regularly only possible with the help of random sample tests.
The necessary and underlying mathematics and statistics are not trivial. However, recipes (see chapter 3.2) and tools (see chapter 3.3) simplify their application for dealing with AQL.
The concept of Acceptance Quality Levels and the ISO 2859-1 standard has been criticized (e.g., in this German forum). Nevertheless, AQLs and the standard are part of the toolbox of quality experts.
Companies should no longer use AQLs but ISO 16269-6 to validate critical processes. When choosing a procedure, companies should consider:
- They should be able to justify their choice of procedure for sample calculation.
- In doing so, they should argue on a risk-based basis.
The quality and validation experts at the Johner Institute support IVD and medical device manufacturers in setting up and improving QM systems and, thus, also in validating processes and computerized systems. This enables manufacturers to gain certainty during audits and the development and manufacture of their products.
Get in touch if you have any questions or would like support.


